Posts Tagged ‘Ground-based Observations’

Planck sees the Crab

September 29, 2009

[cross-posted from Planck UK site]

Last week, the Planck satellite observed the Crab Nebula, also known as M1 from Messier’s catalogue, and Tau A to radio astronomers. The Crab Nebula is one of the brightest objects in the sky at radio and sub-mm wavelengths, and is used by many astronomers to calibrate their instruments. It is the remnants of a star which underwent a violent and catastrophic explosion at the end of its life, an event known as a supernova. The Crab Nebula is associated with one of the few supernovae which was observed, as it was seen by Chinese and Arab astronomers in 1054.

Hubble image of the Crab Nabula
Hubble Space Telescope image of the Crab Nebula, showing the colourful nebula and filaments. Image credit: NASA/ESA

After the supernova, the outer layers of the star were scattered widely into a huge cloud of gas, which we now see as a nebula, and is frequently observed by amateur and professional astronomers. The core of the star ended up as a pulsar, a rapidly rotating, magnetised neutron star. However, it is the surrounding nebula that Planck is interested in. The nebula is around 13 lightyears across, which is around 10,000 times larger than our solar system (depending on where you define the edge). It is also relatively close in astonomical terms, at about 6 lightyears distance, and so is also relatively large in terms of astronomical objects see from Earth. It is around 7 arcminutes across, which is 7/60th of a degree, or about 1/4 the diameter of the full moon as seen from Earth. The smallest of Planck’s beams on the sky is 5 arcminutes and the largest 30 arcminutes, so to the majority of Planck’s detectors the Crab Nebula will have appeared as a “point source” – a single blip in the data. However, it is so bright that it would still be very obvious.

SCUBA measurements of the Crab nebula
SCUBA image of the Crab Nebula at 350GHz. The colour shows the brightness (blue/black=dark, red/white=bright), and the length og the black lines shows the relative amount of polarisation. Image credit: J.S. Greaves, W.S. Holland & T. Jenness (Joint Astronomy Centre)

Because the central pulsar is magnetised, the Crab Nebula is permeated by a magnetic field. This causes any electrons in the nebula, of which there are many, to spiral around the magnetic field lines and emit radiation known as synchrotron radiation. This radiation, which is brightest at radio wavelengths, but still very strong at Planck frequencies, is polarised, which makes the Crab an ideal object for calibrating the polarisation-sensitive detectors on Planck. Many experiments have observed its polarised radiation, including the SCUBA instrument on the JCMT on Hawaii, which observed it at 350GHz (a wavelength of 850 microns). One of the properties of synchrotron radiation is that it varies in a fairly predictable way with frequency, so it is possible to tell from an observation at one frequency what it will look like at another.

The data will take time to analyse, but will be ingested into the Planck database and used to help calibrate its instruments. The Crab Nebula is not the only calibration source, but is the best single source in the sky for calibrating the polarisation angles.  Other non-polarised sources include the planets in our own solar system, particularly Jupiter, which are very bright at Planck’s frequencies as well as to the naked eye.

Tracking Planck and Herschel

May 21, 2009

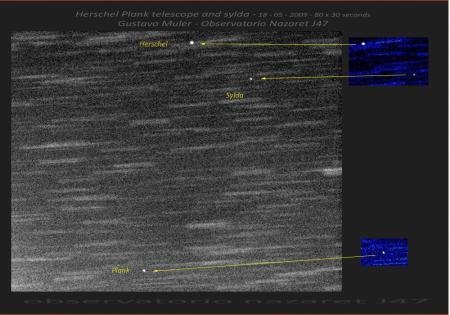
As well as the official ESA ground stations which are tracking Planck and Herschel, a group of (mainly) Spanish astronomers have been observing them with optical telescopes.  They’ve also identified a few other pieces of the Ariane 5 upper stage travelling along with them, as well as the Sylda adapter which separated them within the rocket fairing.

Optical observations of Planck, Herschel and the Sylda adapter

Optical observations of Planck, Herschel and the Sylda adapter

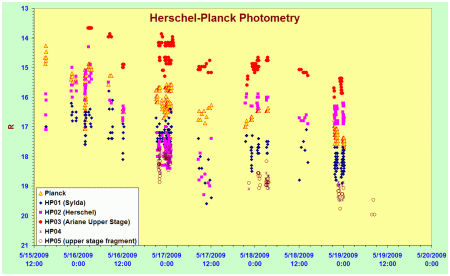
On their “Images” page, you can see some light curves – which show how the brightness of the objects varies with time – for Herschel, Planck, Sylda, and a few other fragments.  The vertical axis, labelled “R”, is the brightness in astronomical units of “magnitudes“.  For comparison, the faintest stars visible with the naked eye are around magnitude 6, and a higher number means fainter – I’m sure this made sense to Ptolemy and Hipparchus.  In fact, the scale is logarithmic, so a magnitude of 17 is about 10,000 Ifainter than magnitude 6, putting them at around the same brightness as a small asteroid or a larger Kuiper Belt Object.

Light curves of Herschel, Planck and a few other fragments

It’s interesting to see that Herschel brightens by about 2.5 magnitudes (about a factor of 10) at one point.  There is one very plausible explanation for this: the timing coincides pretty much with the orbital manoeuvre which Herschel executed on 18th May, which must have oriented the solar panels to a more favourable angle for reflecting sunlight back to Earth.  Planck and the other fragments show smooth gradual declines in brightness over time as they get further from Earth.

So here’s where I make a prediction, just as any scientist should.  I predict that Sylda and the fragments will eventually fall back to Earth and burn up, so they might brighten a little.  They’re almost certainly in elliptical orbits so may vary slightly as their distance from Earth changes, and also if they’re spinning or tumbling at all. [I’ve been corrected by Bill Gray (see comment), who informs us that Sylda and the fragments will end up in heliocentric orbits – i.e. orbiting the Sun]. Planck’s brightness should stabilise when it reaches its final orbit around L2, as its angle realtive to the Earth and Sun should stay pretty much constant.  I predict that Herschel, however, will show slight variations in brightness as it slews to point at various objects around the sky – though it has to keep its solar panels pointed somewhere towards the Sun.  Whether the variations will be large enough to observe with telescopes on Earth remains to be seen.

If you want to see how far Planck and Herschel are from Earth, then you can use the JPL Horizons catalogue.  It’s somewhat self explanatory, but the output can look a little technical.  Change the “Target Body” and search for “Herschel” or “Planck”.  You also have to make sure that the time span covers the range you want.  For teh table output, I recommend selecting “Obsrv range and rng rate” and “One-Way Light-Time” – though there are many to choose from (though not all applicable).  You can set some of the units in the “optional” section.  When you hit “Generate ephemeris” you’ll get a table showing the numbers you’ve requested, and even a table explaining what they all mean.  There are a few options if you want to export the results to a file your favourite spreadsheet programme can read, so you can make your own plots.  You can play with a few other things too, such as setting the observer location to L2 (by putting “@392” in the “Lookup Named Location” box).  It’s not certain that the orbital parameters used are exactly what Planck and Herschel will actually use, but they’re probably not too far off.

On their “Images” page, you can see some light curves – which show how the brightness of the objects varies with time – for Herschel, Planck, Sylda, and a few other fragments.  The vertical axis, labelled “R”, is the brightness in astronomical units of “magnitudes“.  For comparison, the faintest stars visible with the naked eye are around magnitude 6, and a higher number means fainter – I’m sure this made sense to Ptolemy and Hipparchus.  In fact, the scale is logarithmic, so a magnitude of 17 is about 10,000 Ifainter than magnitude 6, putting them at around the same brightness as a small asteroid or a larger Kuiper Belt Object.

Planck and Herschel as seen from the ground

May 20, 2009

As they started on their way to L2, the Planck and Herschel satellites were observed from Earth.  The ESA “Optical Ground Station” on Tenerife, which is one of the stations that tracks ESA satellites and monitors their progress, observed them a few hours after launch and made this animation.  At this time – around 21:30 GMT on 14 May 2009, just over 8 hours after launch – they were 100,000 km from Earth.  That’s already a quarter of the distance to the Moon, but only around 1/15th of their final distance from Earth – L2 is 1,500,000 km from Earth.  They were also seen by the Faulkes Telescope in Australia.  In both images, there are 3 moving dots.  The two brighter ones are Herschel and Planck while the fainter one, which is quite close to Planck, is the SYLDA 5 fairing which separated the two spacecraft in the rocket.

Soon the spacecraft will be much, much further away, and much more difficult (if not impossible) to see – at a few metres across they’re right on the lower limit of the smallest near-Earth objects observed.  Their brightness will primarily be due to the reflectivity of the solar panels.  Since these are pointed towards the Sun, and therefore almost at Earth, it might work out now and again as Herschel and Planck move in their orbits.  I haven’t crunched the numbers to work out if this is possible (exercise for the reader?), but it should certainly be a challenge.